Versions of the eHive
The first eHive with version number 0.1 was built by a school seminar of the "Deutschhaus-Gymnasium" in Würzburg back in 2014. This prototype was stocked with bees and operated for one year. During operation, data was collected on location. In 2015 it was replaced with the eHive 0.2 that was built in cooperation with the "Franz-Oberthür-Berufsschule". This version was shipped to our partners from the EU project. At first, it did not work properly, but until April 2016 amendments were applied. Since then the eHives work comparatively stable.
Since 2017 eHives are distibuted by the BeeBIT association. After the first two eHives, the design was slightly changed, but the functionality stayed the same. Hence, the eHive 1.2 is the only one that can be purchased at the moment. The weather station at all different versions of the eHive is the "Davis Vantage Pro 2 Plus Cable".
eHive 0.2
The eHive 0.2 exists in two models: As "Zander" hive (eHive 0.2.1) and as "Top-Bar-Hive" (eHive 0.2.2). At the beginning all eHives were Top-Bar-Hives, because these allow the bees to live closer to nature. A small hive with 13 not-preshaped honeycombs was used. In it six temperature sensors were obstucted and one outer honeycomb was replaced by a wooden separation board in order to distribute the sensors symmetrically. A humidity sensor is installed in the lower part of the hive.
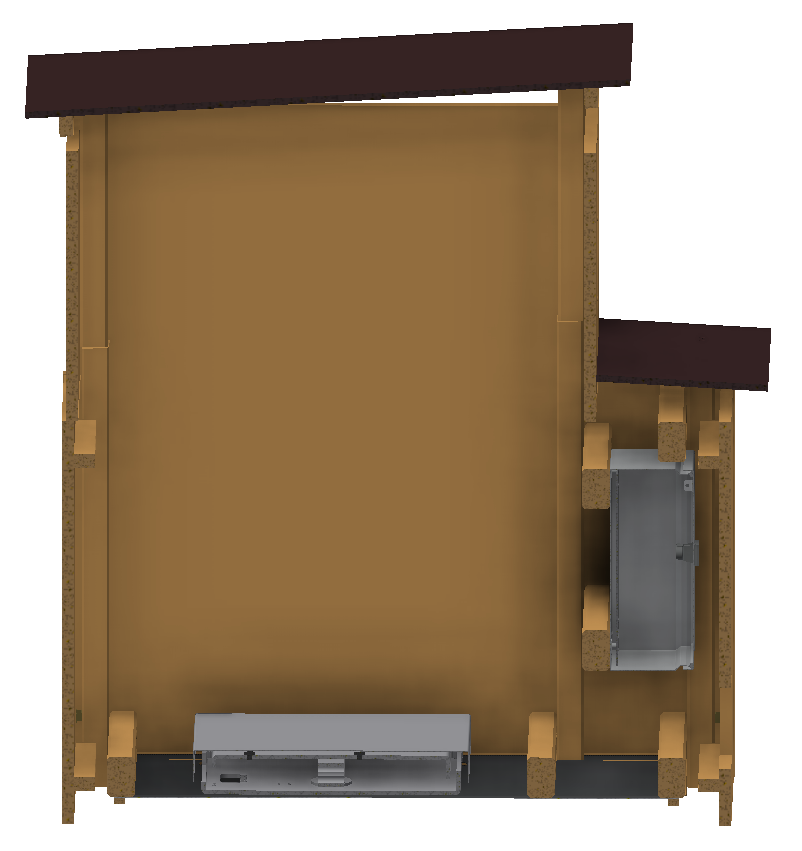
The sensors' data go through a junction box on the side of the hive and are guided from there by a water-resistent RJ-45-cable with screw connectors until the data ends up in the actual junction box that contains all the electronic componentes. At some eHives this box is mounted on the other side of the eHive, at some it is attached to different support structures or is laying on the ground.
To offer compatibility with other hives some of the eHives were converted to other hive-types (other than the Top-Bar-Hive). During conversion only five temperature sensors were installed due to spatial limits. The weather station was attached to an external support. This produced different hights of the weather stations and their wind detectors and different distances to the corresponding eHive. For weather protection a roof had to be provided by the local institution. It was not possible to enforce this on all location.
eHive 1.1
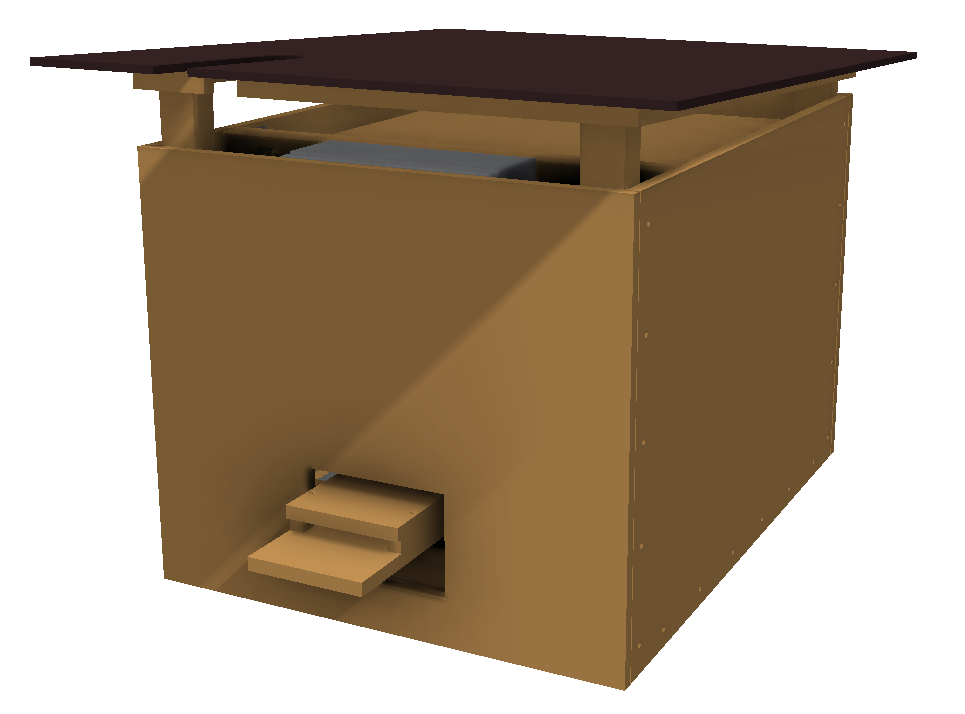
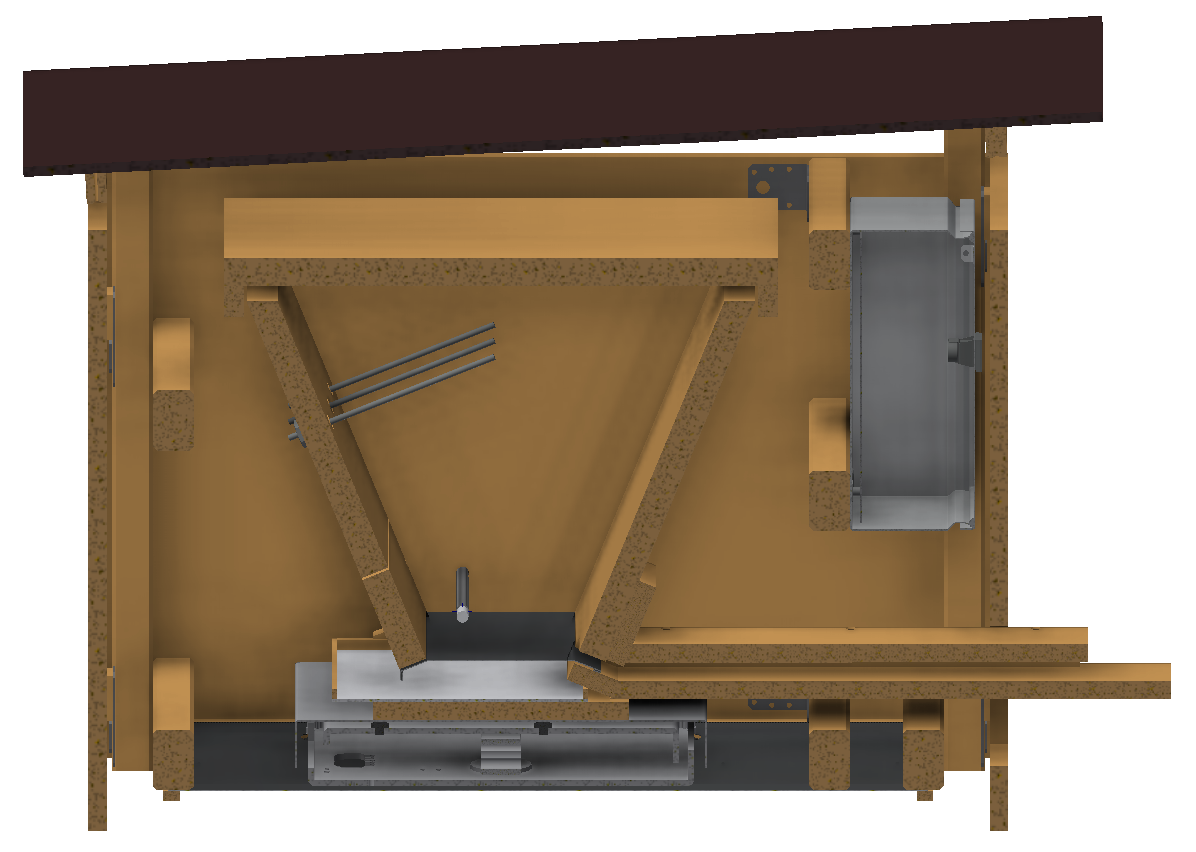
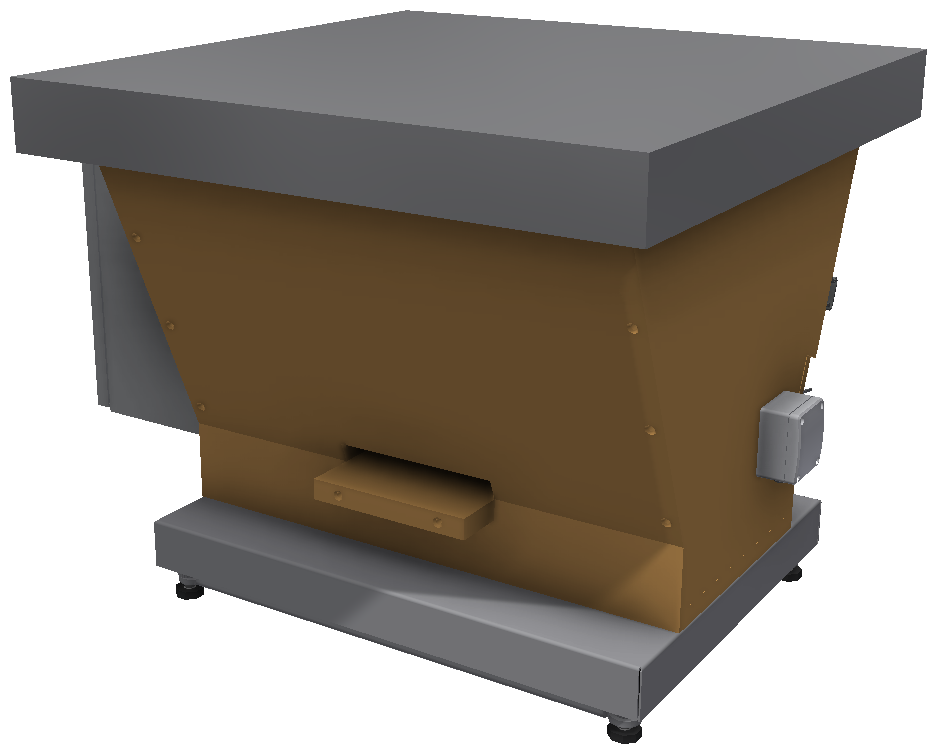
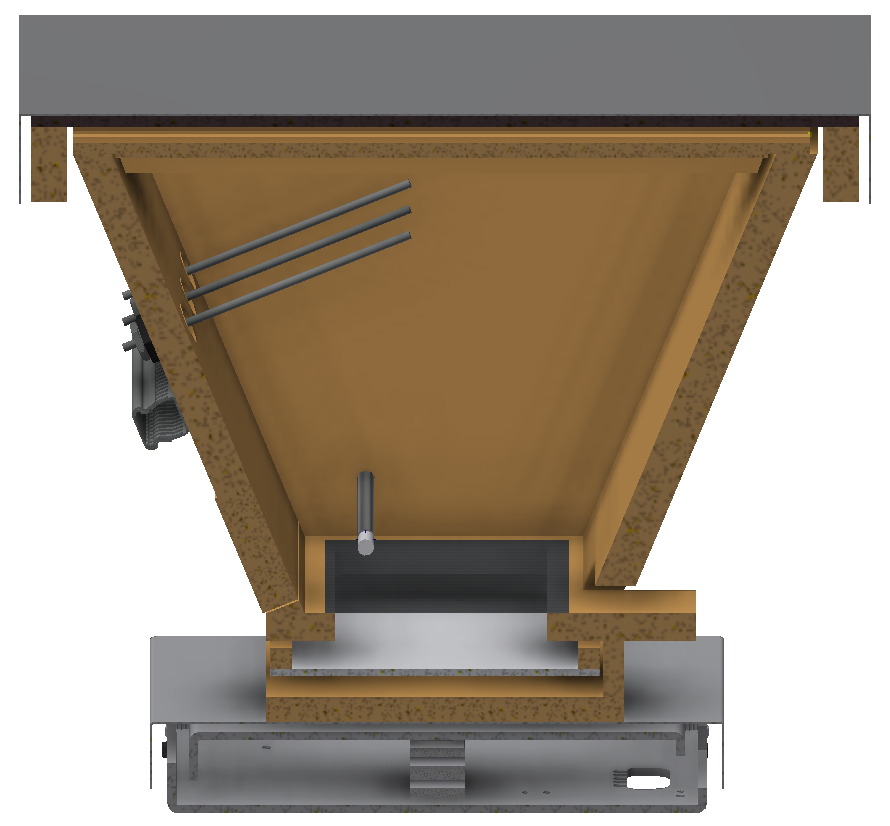
The two hives of version 1.1 were built in early 2017 with the most strinking change being the new wooden outer case. It contains the eHive and all electronic components and serves as a weather protection. At this outer case the attachment for the weather station is mounted. The height of the weather station was defined to be 2 m and the height of the wind sensor 10 m. Both eHives are built as Top-Bar-Hives and have the dimensions of a Zander hive for 12 honeycombs at the top part. Between the combs six temperature sensors are installed. Both the temperature sensors' connection cables as well as the cables from the humidity sensor, the scale and the weather station are guided directly to the central junction box. This avoids unnecessary causes of defect. Because no more eHives of version 1.1 are planned, this version does not exist in other hive types than the Top-Bar-Hive.
eHive 1.2
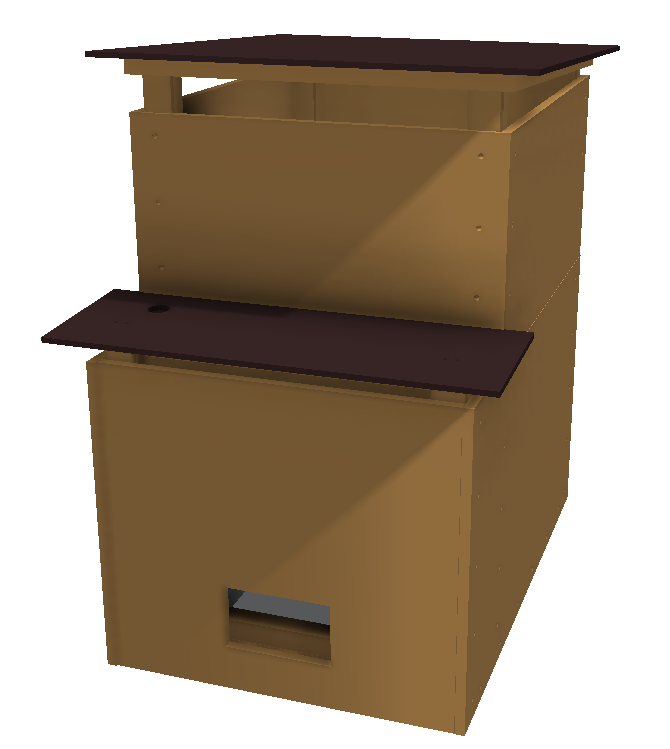
The eHive 1.2 is almost identical to version 1.1, only some changes at the outer case were made. It is enlarged by a removable heightening in order to support hive types with multiple honeycomb boxes. Furthermore, the roof is divided into two parts. This simplifies the usage and allows a waterproof lead through of the weather station's mounting rod though the smaller non-removable roof. The first eHive of version 1.2 was shipped in early 2019. Since then, it can be purchased with different hive types (almost all popular types as well as Top-Bar-Hive).
(jg) 2019-02-28
Talks, Publications, Networks
Talk at the "Technische Universität München" (TU Munich)
During a didactic teaching seminar in the summer term (2017 and 2018) with focus on "Innovations in the didactic of natural sciences - gain of scientific knowledge using the honeybee model organism" Christoph Bauer (vice chairman of BeeBIT e.V.) presented the possible use cases of eHives in school classes and in small research projects in front of university students.
Science On Stage Berlin
In November 2018, Dr. Monika Fröhlich and Christoph Bauer were invited to the national "Science on Stage" festival in Berlin. There they presented innovative teaching methods in front of German teachers. These methods are related to the eHive project. On top of that, experiments about conditioning and the making of durable biological preparations were shown.
Journal article in "Biologie 5-10"
The article "Varrose online erkennen" ("Detect the varroa desease online") was written by Isabelle and Christoph Bauer and published in the journal "Biologie 5-10" of the Friedrich Verlag. In the article a lesson is presented, that is based on the eHives' data. By comparing the weight diagrams of two eHives in the same time period, conclusions about the health of the corresponding bee colonies can be deduced. The article can be downloaded here (only available in German).
eTwinning
The eTwinning platform of the EU allows European students from different countries to work together on educational projects. It will be possible to use the eHives' data for establishing a collective "bee project".
BeeBIT already received the first requests concering this topic. If you are interested in such a project, we would be happy to offer you support.
(cb) 2019-02-27
A peek at some interesting data from the eHives
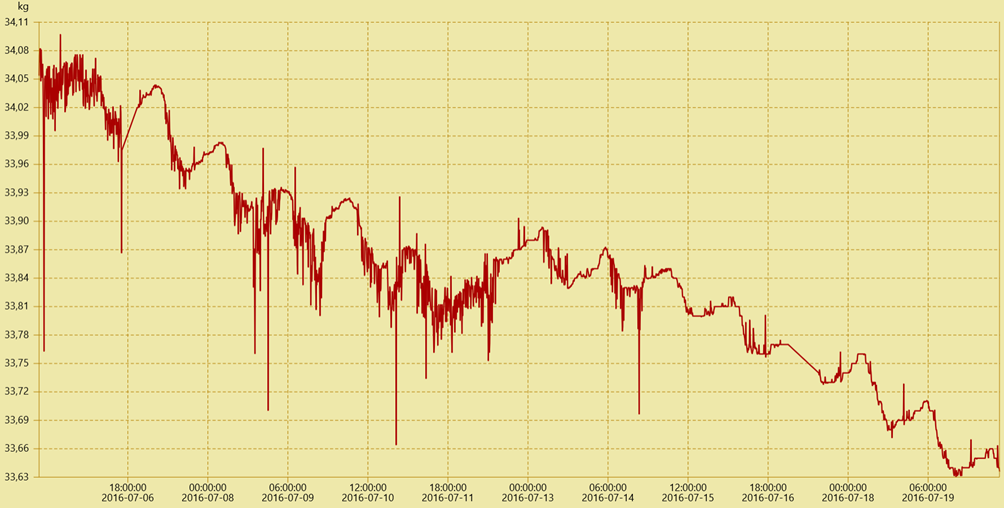
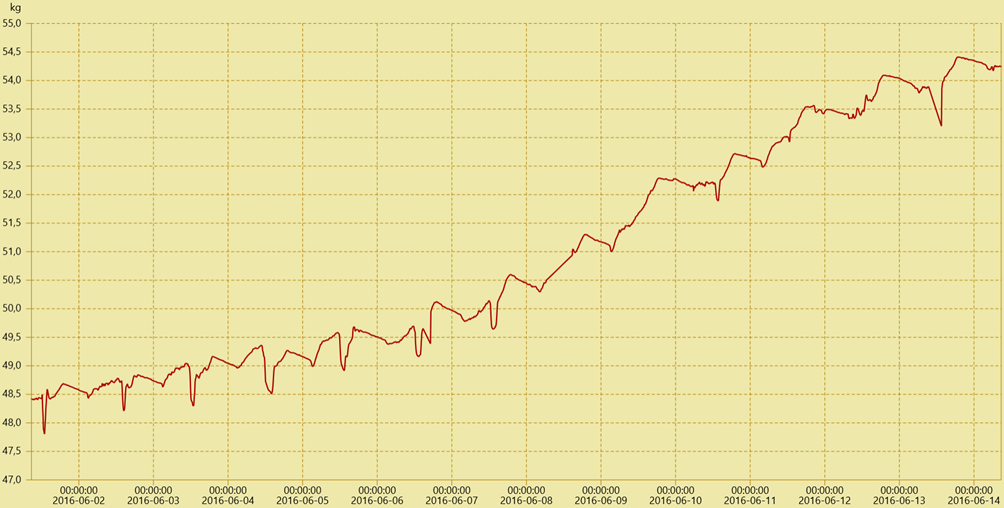
Both diagrams contain data from Summer (June/July), the main harvest season of the honey bee. First, a short description of the diagrams above:
In both charts the weight of the hive is plotted (vertical axis) and they both contain the data of two weeks (horizontal axis). The chart of the first hive (FKG) reveals a steady decrease of about half a kilogram in two weeks. During the same time interval, the weight of the second hive (GSC) rises by five kilograms. Interestingly, the weight always decreases during nighttime and the morning hours, while at the end of the day, the peak weight is higher than the day before.
A short explanation of these charts: Looking only at the GSC hive, the nightly weight decrease shows that the bees also need nourishment during this time. Therefore, they use some of the collected honey and the weight of the hive decreases. In the morning, many of the bees leave the hive for collecting nectar. This results in a steep decrease in weight and even allows an estimate of the number of field bees.
But this doesn’t explain the decrease in weight of the FKG hive. In fact, the data results from an intense infestation of the colony with varroa mites. This has two severe consequences for the colony. Firstly: The total number of bees decreases, since varroa mites mostly affect the brood and infested bees prefer to die outside of the hive to prevent passing the mites on to other bees. Secondly, the varroa mite severely damages the wings of the bees, resulting in a lower number of field bees. Thus, only very few nectar is acquired.
Therefore, the continuous decrease in weight of the FKG hive strongly suggests an infestation with varroa mites.
These charts are highly interesting from a scientific point of view and they show as well the advantage of having comparable E-Hives.
Our data poses a lot of interesting scientific questions. We invite you to work with the data of the eHives to discuss questions like the ones above. If you have any questions regarding this, just contact us.
(cb) 2017-02-09
Renewable Energy Day
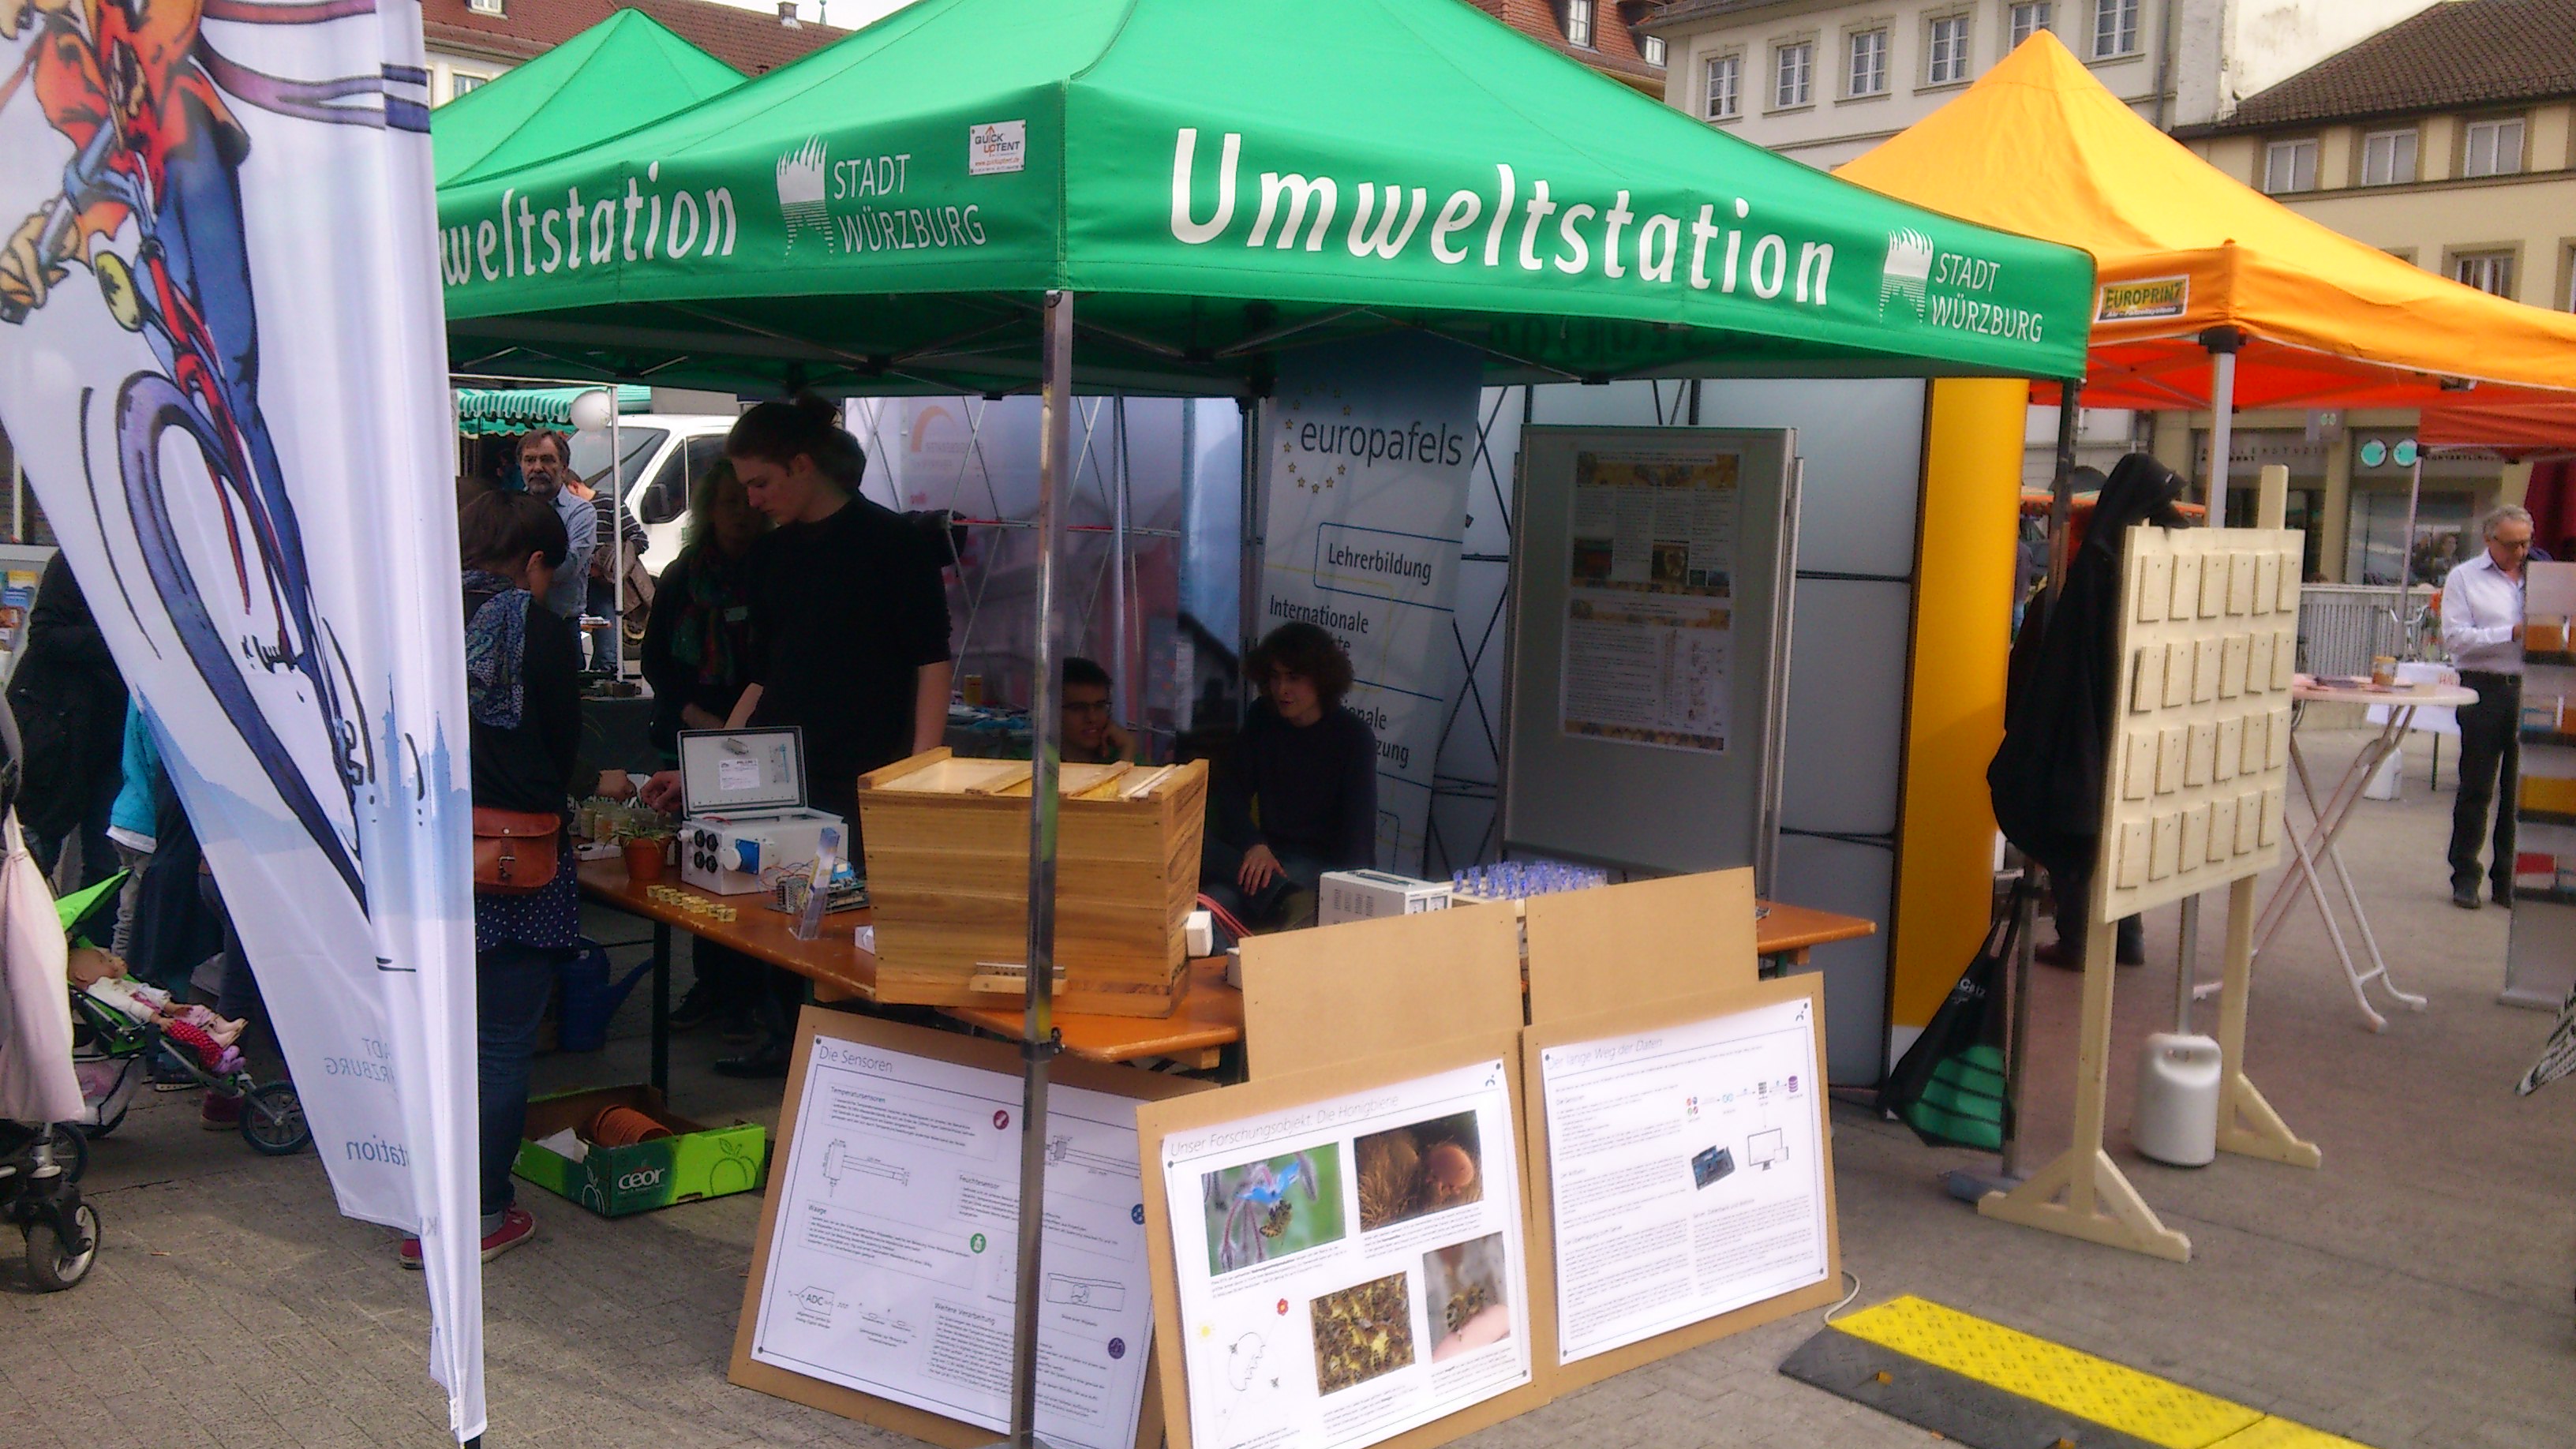
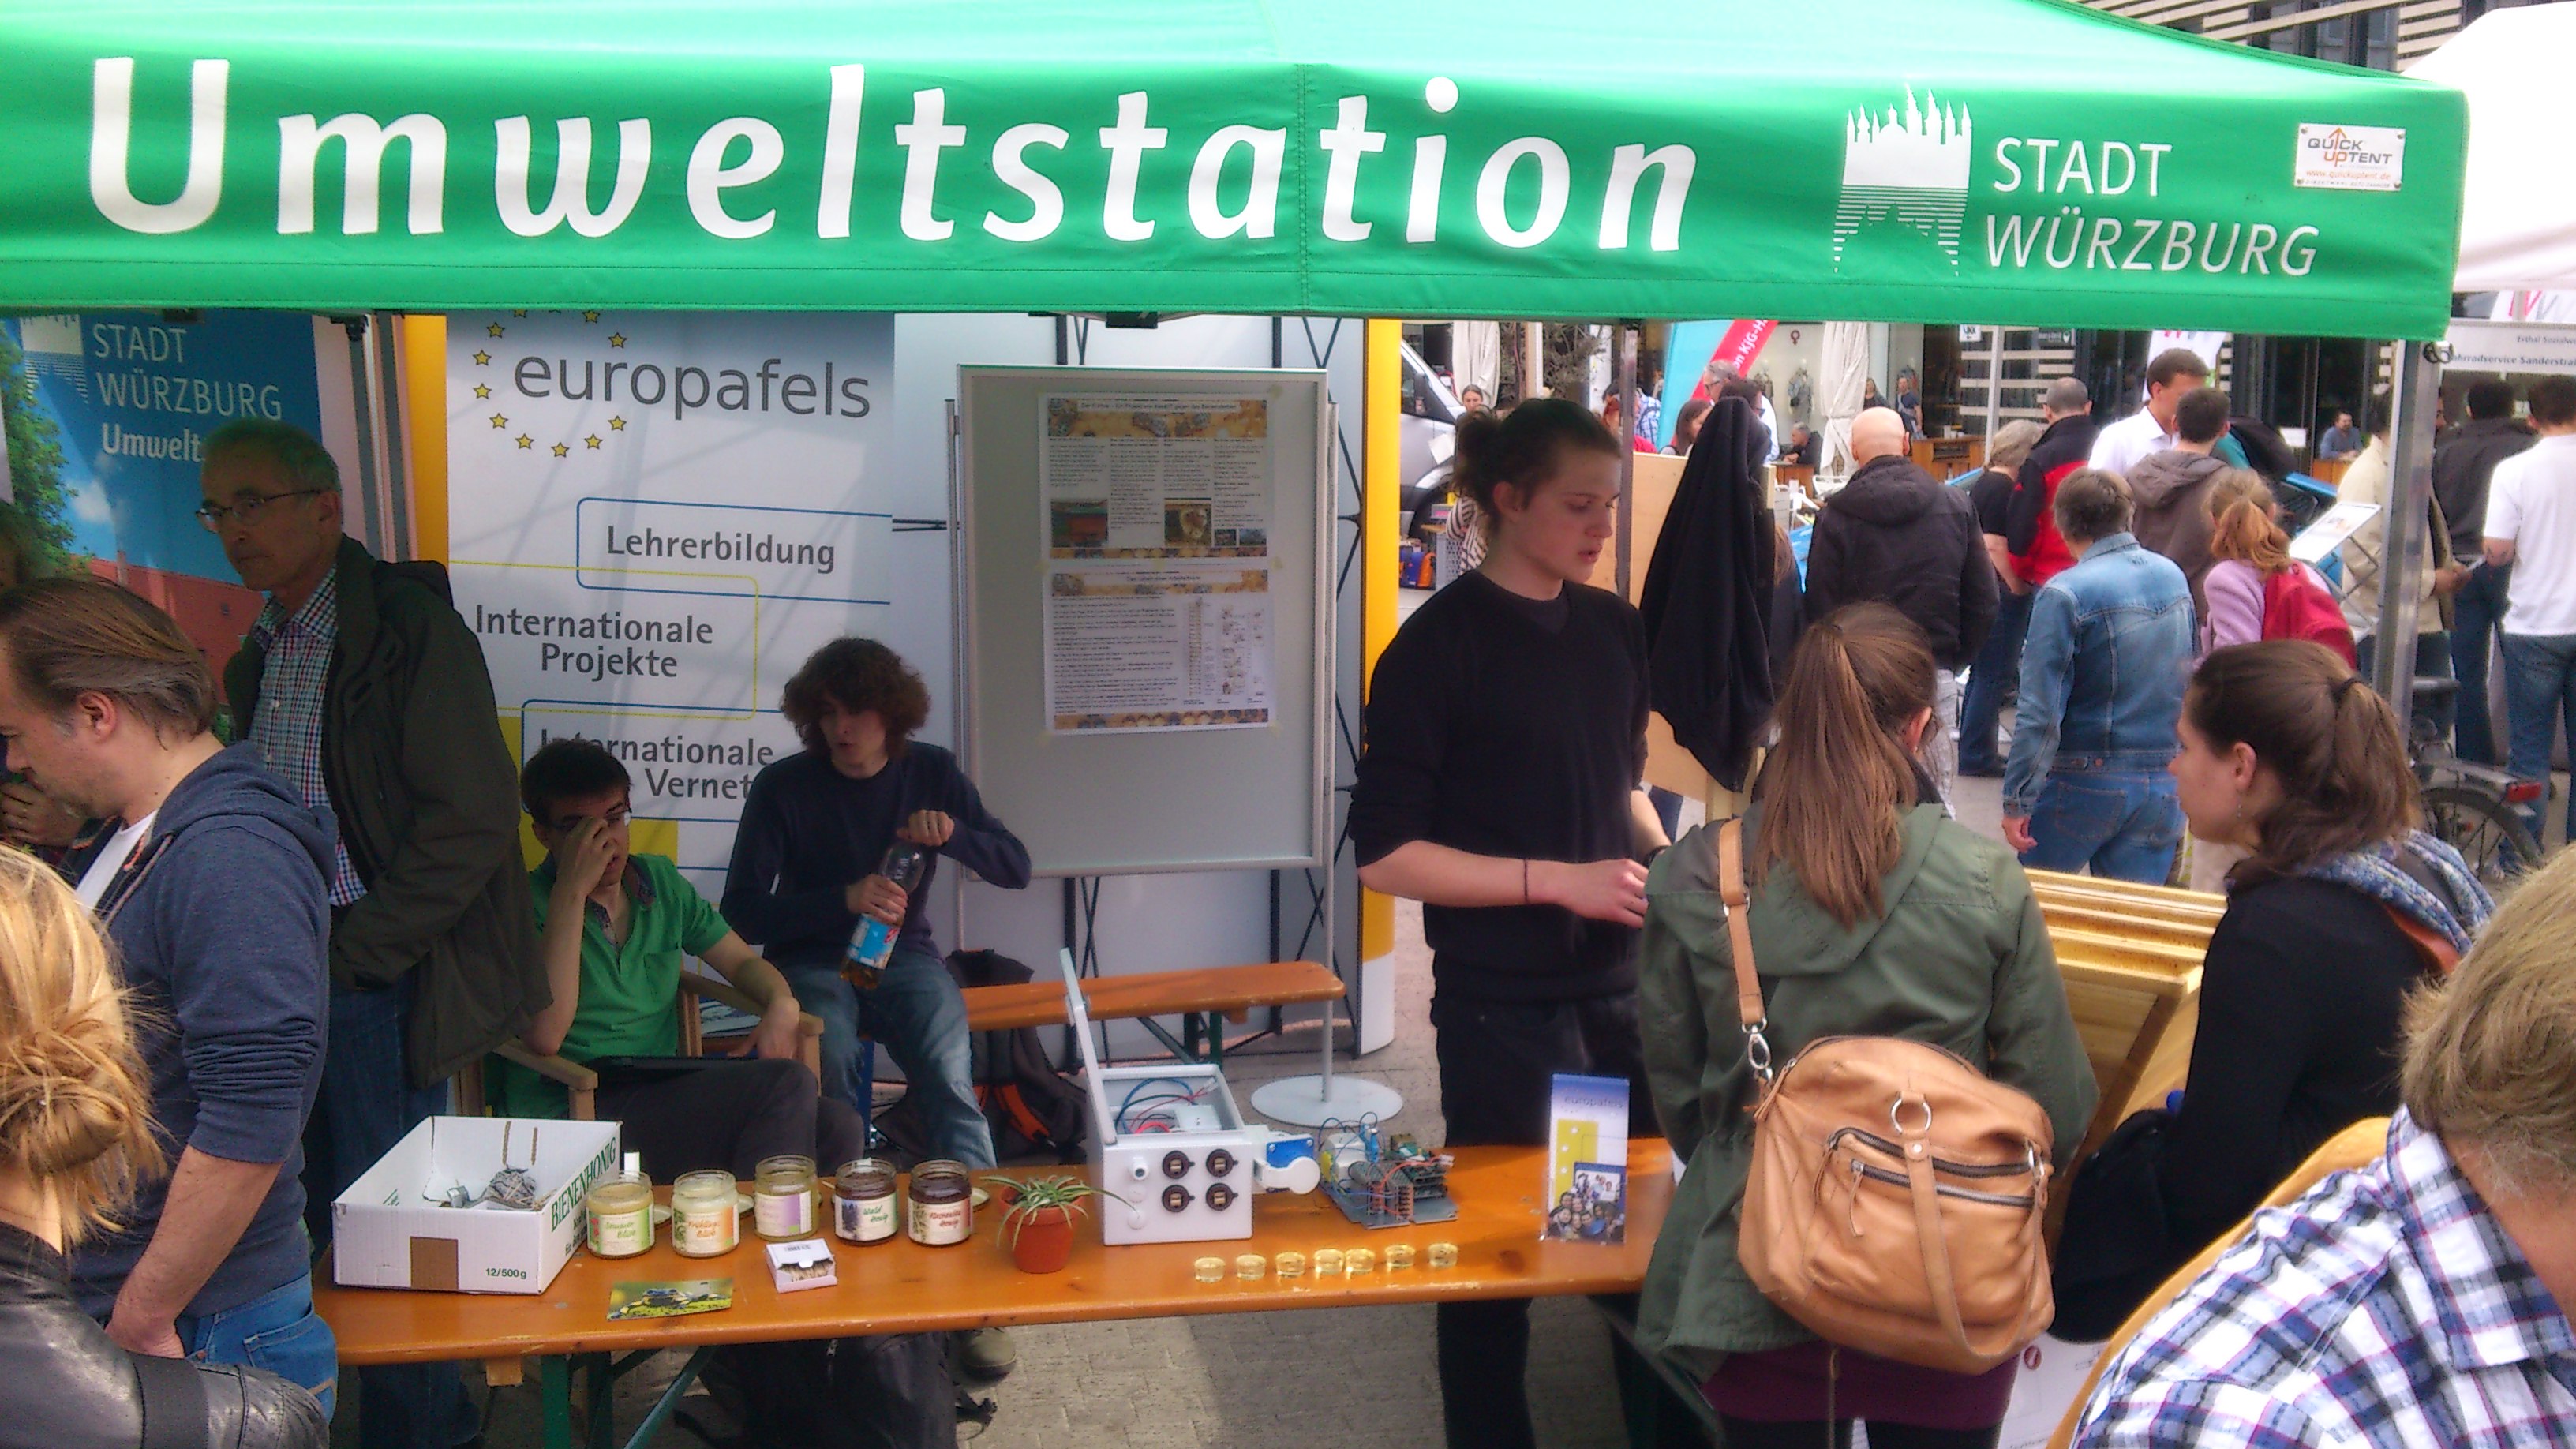
To present our project to the wider public, multiple members of BeeBIT e.V. attended the Renewable Energy Day on 30.04.2016 in Würzburg. At this science fair, multiple projects on nature, technology, and sustainability were presented. The BeeBIT booth attracted visitors with a honey tasting, a model of the eHive, multiple posters, a short feature film about the project, selected school papers by senior graders and, thanks to support by the Environmental Agency of Würzburg, a memory game for children on bees.
Despite the difficulty of presenting the project and its possibilities in education and research to the visitors, we had a lot of fascinating tanks. A special "Thank You" to the senior graders from FKG and DHG high schools that contributed to the booth, and to the Environmental Agency.
(cw) 2016-04-30
Production of the circuit board
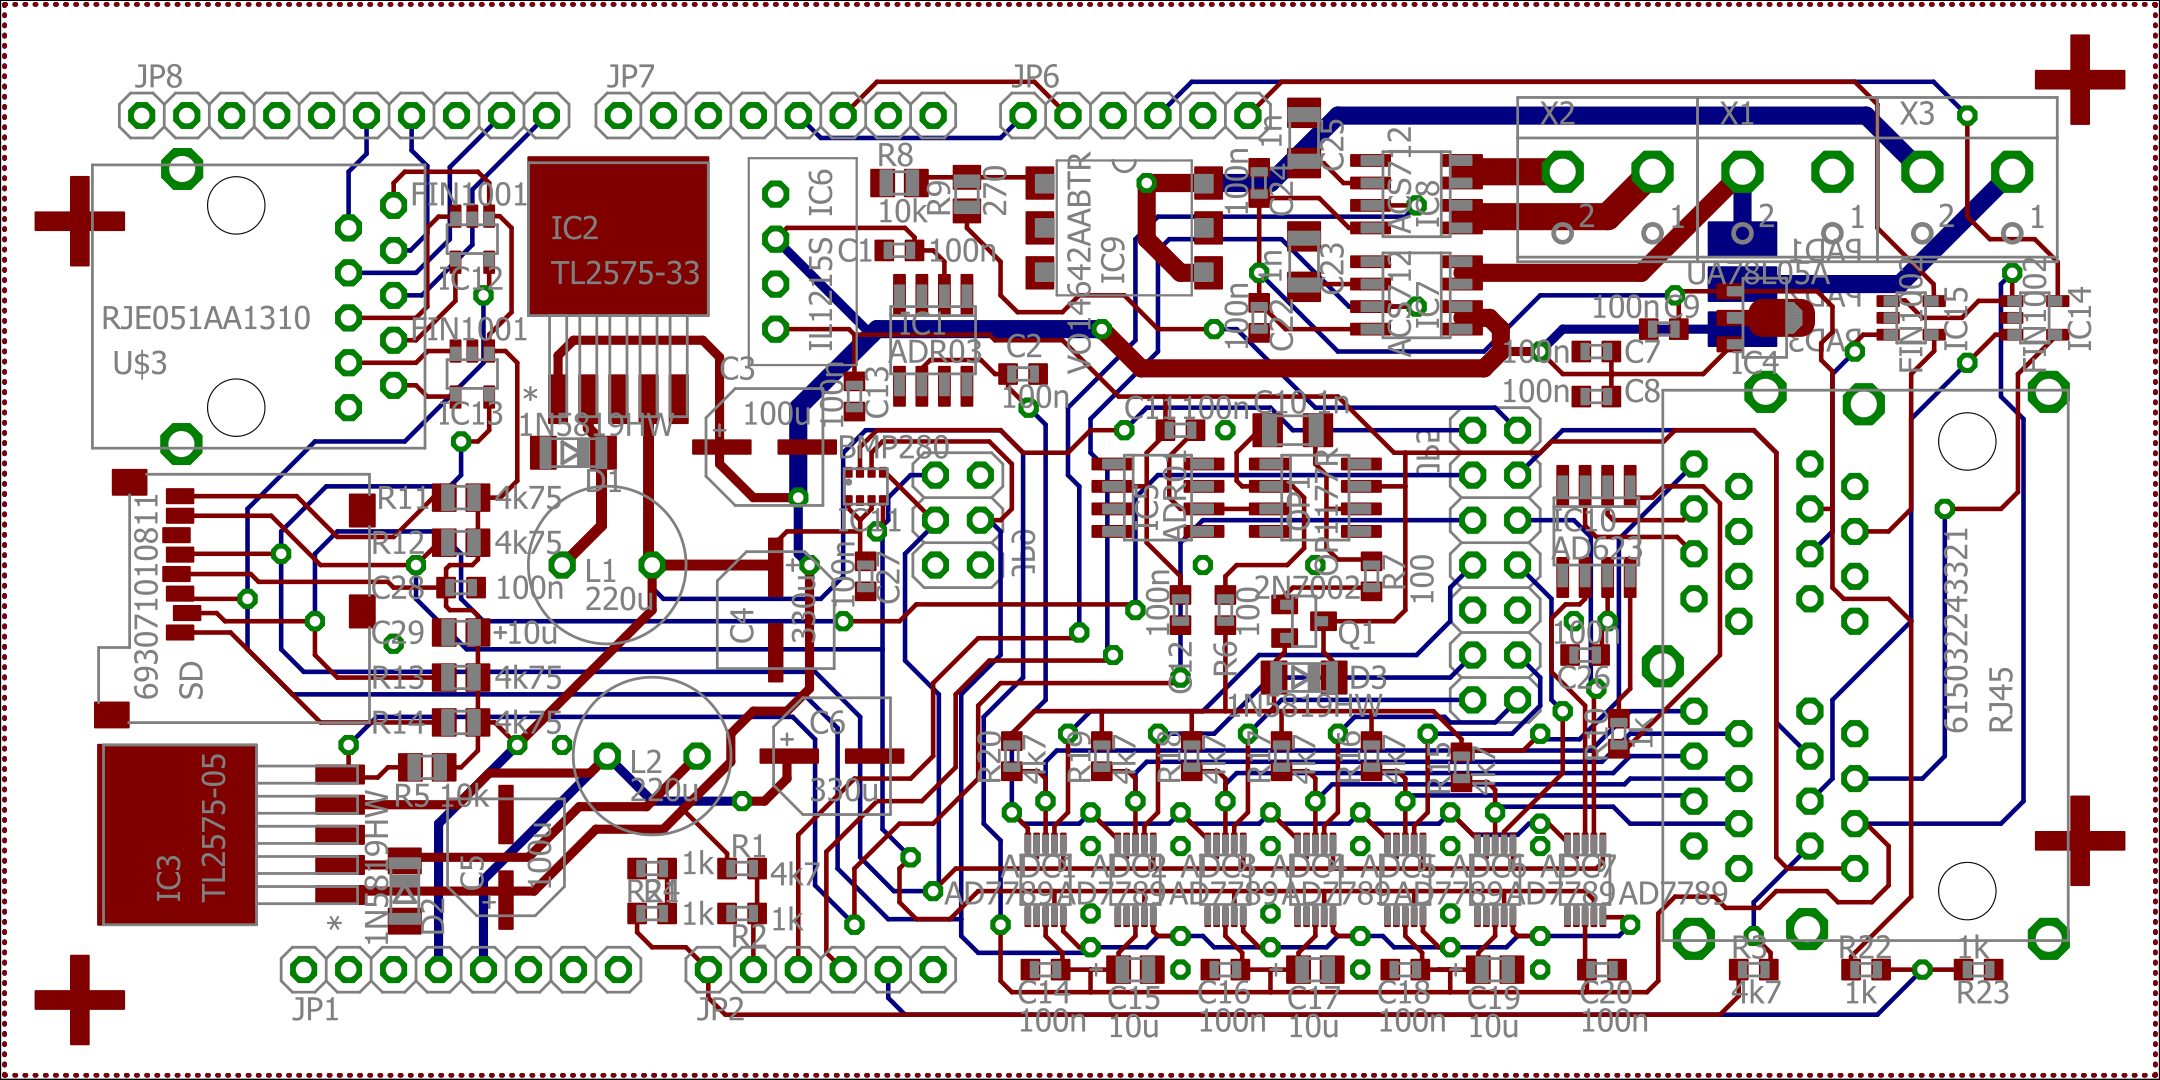
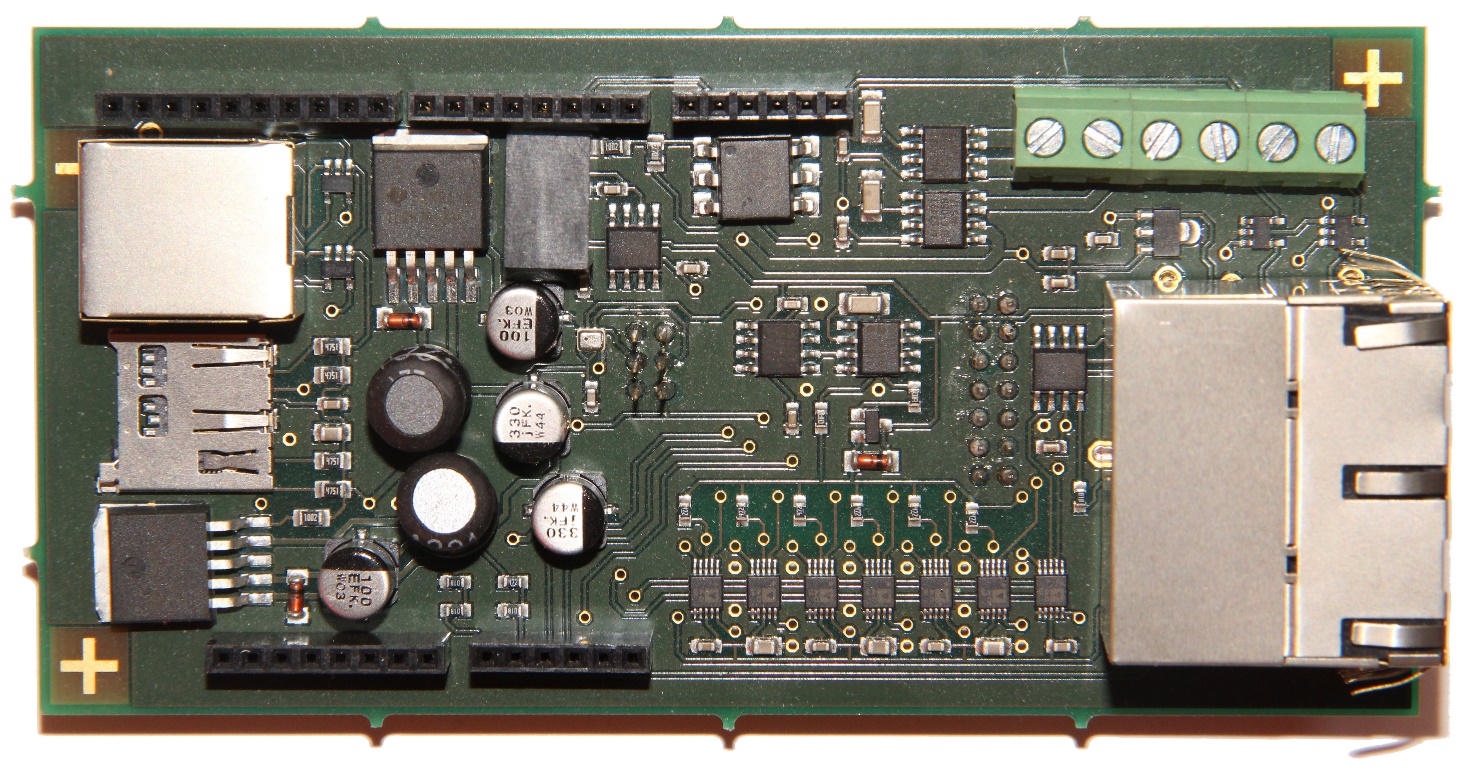
At the beginning of 2016 our self-developed circuit board was kindly manufactured by Schneider Electric free of charge. The board mainly is used to provide 6 different voltage levels which are necessary for properly operating the sensors. Furthermore, it converts analog signals into digital ones. This must be done quite precisely because small differences result in huge aberrations. Regarding the scales for example, a voltage drift of 0.000002V is equivalent to a 10g difference in weight. Furthermore, several sensors for system surveillance are included, such as charging voltage, two current sensors and the barometer. 13 of the 24 produced circuit boards are in use now. 8 of the remaining ones are anticipated to be sold in the coming month and years.
 DE
DE